

Live data plane
See the market move, not just the total.
28.866 Bln so'm
Latest revenue estimate
Market at a glance
Revenuespans differ — not compared
Pick a tile to plot that metric.
Uzumer unifies market, competitor, and seller intelligence in one decision system—reconciled against marketplace counters and published from completed scans.
No account needed — open pages:All shopsAll categories
Revenue
28.866 Bln so'm
days not comparable
Orders
288'119
days not comparable
Shops with sales
16'366
days not comparable
39'372 shops tracked
Average order
100'189 so'm
days not comparable
6'923 categories tracked
Last completed scan · 13 09 2026
Open data
These three lists refresh every day and are fully open. History, competitor sets and export stay behind a plan.
Open any product on uzum.uz and the Uzumer panel opens with it — the full price history, including the Uzum Card price no one else publishes. No account, no card, no trial.
Works on uzum.uz · Uzbek, Russian, English · no sign-up
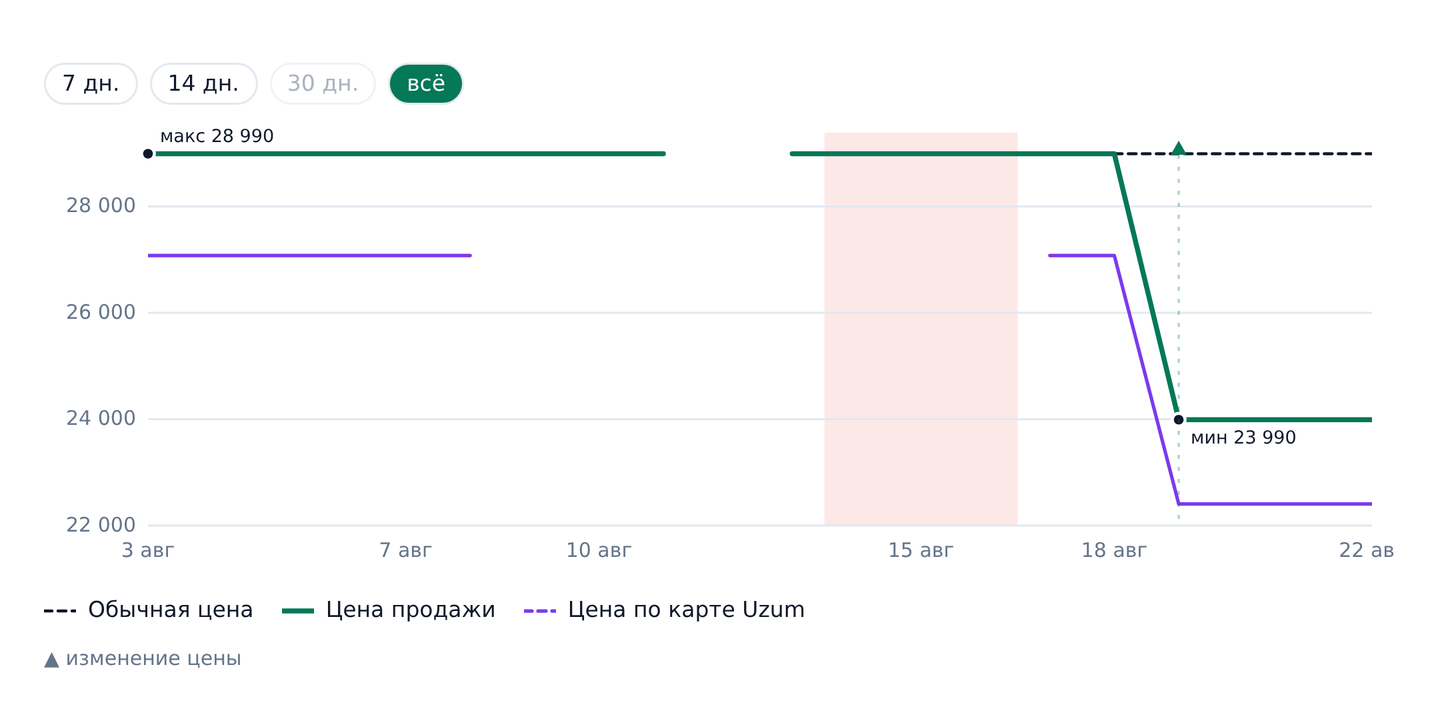
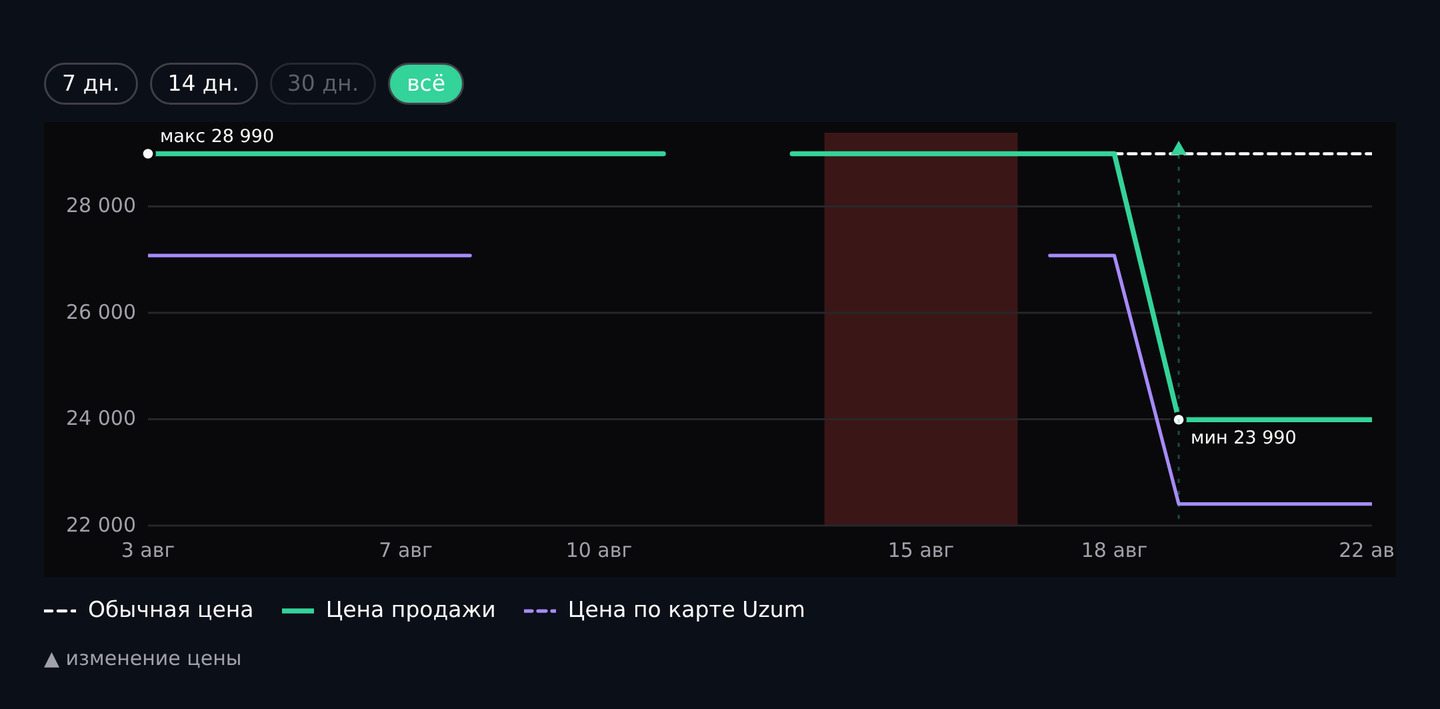
Including the Uzum Card price, which no other tool publishes.
Every product gets a verdict, not just a crossed-out number.
The chart as PNG, the series as CSV — straight from the panel.
Live intelligence cinema
Five live dashboards evolve through one spatial data prism. Follow the sequence or take control with a node, swipe, or direct interaction.
4D market signal space
Autonomous live sequence · hover never interrupts
28.866 Bln so'm
Latest revenue estimate
Market at a glance
Pick a tile to plot that metric.
Live plane: Overview. The sequence keeps evolving; select any signal node or swipe to take the next view.
Three decisions. One workspace.
Start with the outcome you need. Each path opens the signals and tools that move that decision forward.
Compare category momentum, market size, and competition to spot room before it becomes obvious.
Follow product momentum, seller leaders, and pricing shifts while the opportunity is still moving.
Bring assortment, sales, stock, reviews, and profitability into one focused seller command centre.
The whole decision stack
Sixteen focused workflows cover discovery, competition, validation, and daily operations.
See scale, momentum, category structure, and open demand before you commit inventory.
See market revenue, orders, leading products, and category momentum at a glance.
Explore products by revenue, sales, price, stock, ratings, and growth.
Browse the full marketplace category tree and move from parent markets into precise niches.
Compare categories by size, competition, and growth to find promising demand.
Track the products and sellers taking share—and the newcomers moving before the crowd.
Find the products gaining or losing momentum from day to day.
Review any tracked shop's revenue, orders, assortment, rating, and market share.
Spot newly active stores and see which entrants are gaining traction quickly.
Rank sellers by revenue, orders, rating, or day-over-day growth.
Validate demand, compare options, save targets, and return to the changes that matter.
Explore marketplace search terms and the demand signals behind them.
Surface high-demand gaps where competition and supply leave room to enter.
Put products or shops side by side and highlight the differences that matter.
Save products and shops, organize them, and monitor daily changes in one place.
Connect market intelligence with your assortment, margin, visual search, and portfolio focus.
Monitor your own assortment, revenue, sales, and stock from one seller view.
Estimate margin, fees, logistics, returns, advertising, tax, and break-even volume.
Use a product image to look for visually similar marketplace listings.
Classify products by revenue contribution so the items that matter most stay visible.
One product replaces the fragmented research loop across multiple analytics tabs.
Explore every workflowThe Accuracy Lab
Uzumer reduces false spikes and drops with completed-scan publishing, counter reconciliation, coverage checks, and price-integrity filters—then shows the evidence.
Public observations
Scheduled crawls revisit products and shops; discovery delays and missing observations remain possible.
Modelled units, not baskets
Counters, stock and buyer badges inform daily estimates. Order multipliers and fallback allocations are heuristics.
Open-day estimates stay separate
Publication follows the readiness rule. Retained historical partial days carry coverage indicators.
Version and freshness are visible
Responses include calculation time, data-through date and model version. Source corrections can revise past estimates.
Why the fourth gate matters
An interrupted scan reaches the chart and reads as a demand collapse that never happened.
The day is marked unmeasured. We would rather show a hole than a number we never measured.
Latest scan · 13 09 2026
The open day stays separate. Historical gaps and incomplete catalogue coverage remain visible.
Estimated units are cross-checked against available order counters, not forced to equal baskets.
Observed hours and measurement gaps travel with the data instead of disappearing inside a smooth-looking trend.
Heuristic filters reduce suspicious-price effects; actual paid prices and SKU mix remain unknown.
Marketplace figures are estimates from public observations, with gaps and assumptions. Absolute sales and revenue accuracy requires matched seller transaction records.
Comparing 3–4 tools?
Many platforms can draw a trend. The useful question is what happens before the line reaches your screen.
An interrupted collection looks like demand collapsed
Only completed scans enter the published period
You cannot tell a real drop from a partial crawl
Product estimates drift away from marketplace totals
The same-window aggregate is reconciled to readable shop counters
A polished total may have no visible external check
Unequal observation windows create volatile comparisons
Coverage and measured days remain explicit
Changing sample windows can look like market volatility
Placeholder prices inflate market value and averages
Price anomalies are filtered before aggregation
Outliers can silently bend the headline metrics
Choose the platform that shows not only what changed, but why the signal deserves your confidence.
Read the methodologyOne decision system
Start with the complete analytics stack, then move to Pro for higher limits and a longer decision history.
Essential
299'000 UZS/ month
2'990'000 UZS billed yearly
Full dashboards for growing sellers, with practical monthly limits and a 30-day history.
Pro
Recommended799'000 UZS/ month
7'990'000 UZS billed yearly
Higher limits and the full 90-day history for teams and large catalogues.
Straight answers
The date shown on this page is the latest completed scan. Dashboard periods are built only from completed observations.
They are estimates derived from observed marketplace signals. The methodology page explains the model and its limits.
Partial-day crawls, shifting observation windows, counter resets, and placeholder prices can create artificial movement. Uzumer checks coverage, publishes completed scans, reconciles counters, and filters price anomalies before presenting the trend.
Yes. Use the live 4D preview on this page, then create an account to open the full dashboards and current plan options.
Daily market notes, product updates and direct answers from the team that builds Uzumer.
The obvious next move
Enter the live market, see the method behind every signal, and turn today’s movement into an advantage.